Best Free Monitoring Tools for Linux Servers
The best free monitoring tools for Linux servers are Prometheus, Grafana, Netdata, Nagios Core, and Zabbix. These tools offer real-time metrics, alerting, and dashboards without licensing costs. For most users, Netdata provides the easiest setup with instant insights, while Prometheus + Grafana offers maximum flexibility for complex environments. This guide compares the top free options, installation steps, and use cases so you can choose the right tool for your infrastructure.

*Photo by Sergei Starostin on Pexels*
## Why Monitoring Matters for Linux Servers
Without monitoring, you fly blind. Crashes, performance degradation, and security issues go unnoticed until users complain. Free tools eliminate the cost barrier while delivering enterprise-grade capabilities.
Key benefits:
- Proactive issue detection before downtime
- Capacity planning with historical data
- Root cause analysis with logs and metrics
- Reduced operational costs
## Top 5 Free Linux Monitoring Tools
### 1. Prometheus – Best for Metrics Collection
Prometheus is a time-series database and monitoring system. It pulls metrics from targets via HTTP endpoints.
Installation:
“`bash
wget https://github.com/prometheus/prometheus/releases/latest/download/prometheus-*.linux-amd64.tar.gz
tar xvf prometheus-*.tar.gz
cd prometheus-*
./prometheus –config.file=prometheus.yml
“`
Pros: Powerful query language (PromQL), integrates with Grafana, auto-discovery
Cons: Steeper learning curve, no built-in alerting
### 2. Grafana – Best for Visualization
Grafana turns raw metrics into beautiful dashboards. It works with Prometheus, InfluxDB, and dozens of other data sources.
Installation (Ubuntu/Debian):
“`bash
sudo apt-get install -y software-properties-common
sudo add-apt-repository “deb https://packages.grafana.com/oss/deb stable main”
sudo apt-get update
sudo apt-get install grafana
sudo systemctl start grafana-server
“`
Pros: Rich visualizations, community dashboards, alerting
Cons: Requires a data source (like Prometheus)
### 3. Netdata – Best for Real-Time Monitoring
Netdata provides per-second metrics with zero configuration. It monitors CPU, memory, disk, network, and hundreds of applications.
One-line install:
“`bash
bash <(curl -Ss https://my-netdata.io/kickstart.sh)
“`
Pros: Instant setup, low overhead (1% CPU), interactive charts
Cons: Limited historical retention (default 1 hour), no native alerting

*Photo by Negative Space on Pexels*
### 4. Nagios Core – Best for Alerting
Nagios is the veteran of monitoring. It checks services, hosts, and network devices, sending alerts via email/SMS.
Installation:
“`bash
sudo apt-get install nagios-core nagios-plugins
“`
Pros: Highly customizable, mature plugin ecosystem, excellent alerting
Cons: Outdated UI, complex configuration files
### 5. Zabbix – Best for All-in-One
Zabbix combines monitoring, alerting, and visualization in a single package. It supports SNMP, JMX, and agent-based monitoring.
Installation:
“`bash
sudo apt-get install zabbix-server-mysql zabbix-frontend-php
“`
Pros: Built-in dashboards, auto-discovery, scalable
Cons: Heavy resource usage, MySQL dependency
## Comparison Table
| Tool | Type | Setup Time | Alerting | Visualization | Best For |
|---|---|---|---|---|---|
| Prometheus | Metrics DB | 20 min | No (add Alertmanager) | No (use Grafana) | Cloud-native apps |
| Grafana | Visualization | 10 min | Yes | Yes | Dashboards |
| Netdata | Agent | 2 min | No | Yes | Quick insights |
| Nagios Core | Check engine | 1 hour | Yes | Basic | Legacy systems |
| Zabbix | Full stack | 30 min | Yes | Yes | Enterprise |
## How to Choose the Right Tool
For beginners: Start with Netdata. Install it on a test server and explore metrics immediately. No configuration needed.
For developers: Use Prometheus + Grafana. Export metrics from your apps via client libraries (Go, Python, Node.js). Build custom dashboards.
For sysadmins: Choose Zabbix or Nagios. Both support SNMP for network devices and agent-based monitoring for servers.
For containers/Kubernetes: Prometheus is the standard. It scrapes metrics from Kubernetes API and container runtimes.
## Step-by-Step: Monitor a Linux Server with Prometheus and Grafana
1. Install Prometheus (see commands above)
2. Configure targets – Edit `prometheus.yml`:
“`yaml
scrape_configs:
- job_name: ‘node’
static_configs:
- targets: [‘localhost:9100’]
“`
3. Install Node Exporter for system metrics:
“`bash
wget https://github.com/prometheus/node_exporter/releases/latest/download/node_exporter-*.linux-amd64.tar.gz
./node_exporter
“`
4. Install Grafana and add Prometheus as data source
5. Import dashboard – Use ID 1860 (Node Exporter Full) from Grafana.com
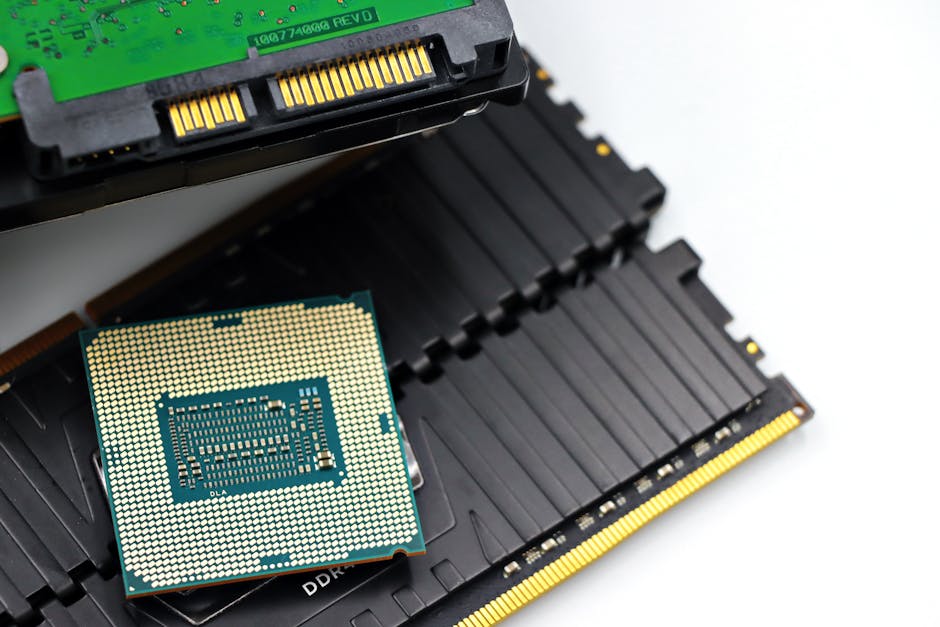
*Photo by Alfin Auzikri on Pexels*
## Best Practices for Free Monitoring
- Set up alerting – Use Prometheus Alertmanager or Grafana alerts for critical metrics (CPU > 90%, disk > 80%)
- Store historical data – Configure retention in Prometheus (default 15 days). Use Thanos for long-term storage
- Monitor logs too – Pair with Loki (free) or ELK stack for log analysis
- Secure access – Use reverse proxy with SSL for Grafana/Zabbix web UIs
- Test alerts – Simulate failures (e.g., stop a service) to verify notifications
## Common Pitfalls to Avoid
- Too many alerts – Only alert on actionable thresholds. Noise leads to ignored alerts
- No historical data – Without retention, you can’t spot trends. Set `–storage.tsdb.retention.time=30d`
- Ignoring disk I/O – High disk latency causes slow applications. Monitor `iowait` and `await`
- Missing application metrics – System metrics alone aren’t enough. Instrument your apps with custom metrics
## Conclusion
Free monitoring tools for Linux servers are powerful, mature, and production-ready. Netdata gets you started in minutes, while Prometheus + Grafana scales to complex environments. Zabbix and Nagios remain solid choices for traditional setups. Choose based on your team’s skills and infrastructure complexity.
Start monitoring today and prevent costly downtime. Visit freefile.store to download ready-to-use scripts, dashboards, and automation templates for all these tools. Our collection includes pre-configured Prometheus exporters, Grafana dashboard JSON files, and Nagios plugins – all free to use.
CTA: Download free monitoring scripts and templates at freefile.store →